
107% Sales Growth While Cutting ACoS in Half
How a 100+ ASIN UK catalogue scaled monthly sales by replacing equal-budget management with a tiered, tool-led operating system.
Food storage, catering, and disposable kitchen essentials for household and commercial buyers. A 100+ ASIN UK catalogue with strong demand but no structured system for pricing, advertising, or portfolio management.
- Marketplace
- Amazon UK
- Category
- Food storage & catering essentials
- Onboarded
- Aug 2025
- Reporting period
- Aug 2025 to Jun 2026
What we achieved
The result was not simply more advertising. It was a clearer, more measurable operating system for deciding where to invest, where to protect profitability, and where to scale.
Performance After Onboarding
Onboarding month through June 2026.
Monthly ordered product sales, Aug 2025 to Jun 2026
Full figures
| Month | Ordered product sales |
|---|---|
| Aug 2025 | £135K |
| Dec 2025 (peak) | £292K |
| Jun 2026 | £279K |
Three of the eleven months are printed with their unit on the original chart; the other eight await the client's figures.
ACoS trend after onboarding
Full figures
| Month | ACoS |
|---|---|
| Aug 2025 | 46% |
| Sep 2025 | 42% |
| Oct 2025 | 39% |
| Nov 2025 | 36% |
| Dec 2025 | 34% |
| Jan 2026 | 33% |
| Feb 2026 | 31% |
| Mar 2026 | 29% |
| Apr 2026 | 27% |
| Jun 2026 | 23% |
May 2026 is omitted: its label sits under the chart's "Target 23%" annotation.
Performance Transformation
- At onboarding
- June 2026
Full figures
| Metric | At onboarding | June 2026 |
|---|---|---|
| Monthly sales | £134.6K | £279.2K |
| ACoS | 46% | 23% |
| TACoS | 20% | 5% |
The Challenge
100+ ASINs scaled without structure. Budget spread evenly, so performance signals were wasted.
No portfolio structure
More than 100 ASINs were managed without product-level priorities or defined roles.
Equal budgets across unequal products
New and established ASINs received similar spend despite major differences in maturity, margin, conversion, and growth potential.
Inconsistent optimization
Campaigns lacked shared rules, causing unstable ACoS and TACoS across the catalogue.
No test, protect, repair, or scale logic
Even budget spread made it impossible to tell which products should be pushed and which should be defended.
Internal competition
Closely related pack sizes and variations competed with each other and reduced performance visibility.
Missed commercial pricing
Relevant products lacked business pricing and quantity discounts, limiting capture of larger business orders.
No dayparting
Advertising ran across weaker hours and lower-converting weekend periods without a structured schedule.
The Approach
Onboarded August 2025. Stabilize first, build an operating system, then scale.
Full account and catalogue audit
- Reviewed the full picture. Sales, ACoS, TACoS, conversion rate, margins, inventory position, campaign structure, pack sizes, and product maturity.
- Surfaced the leaks. Identified overspending, budget restrictions, duplicated targeting, weak search terms, and missed commercial opportunities.
ASIN tiering and budget rules
- Grouped by role. Sorted products into testing, stable, scaling, and recovery tiers.
- Assigned rules per tier. Different budget limits, bid rules, and performance expectations for each group.
- Redirected investment. Moved spend toward products with proven demand, stronger efficiency, and greater growth potential.
Business pricing and quantity discounts
- Added business pricing. Applied to products with clear bulk and commercial buying potential.
- Built quantity discounts. Designed to encourage larger orders from cafes, caterers, takeaways, offices, and event businesses.
- Protected margin. Reviewed pack-size value so larger packs carried a clear commercial incentive without discounting the whole catalogue.
Campaign restructuring and optimization rules
- Reorganized by intent. Rebuilt campaigns by product family, pack size, search intent, and ASIN tier.
- Separated the jobs. Split discovery, profitability, ranking, and scaling campaigns.
- Codified the rules. Applied logic for spend without sales, bid adjustments, negative targeting, budget utilization, and search-term harvesting.
Dayparting and promotional scaling
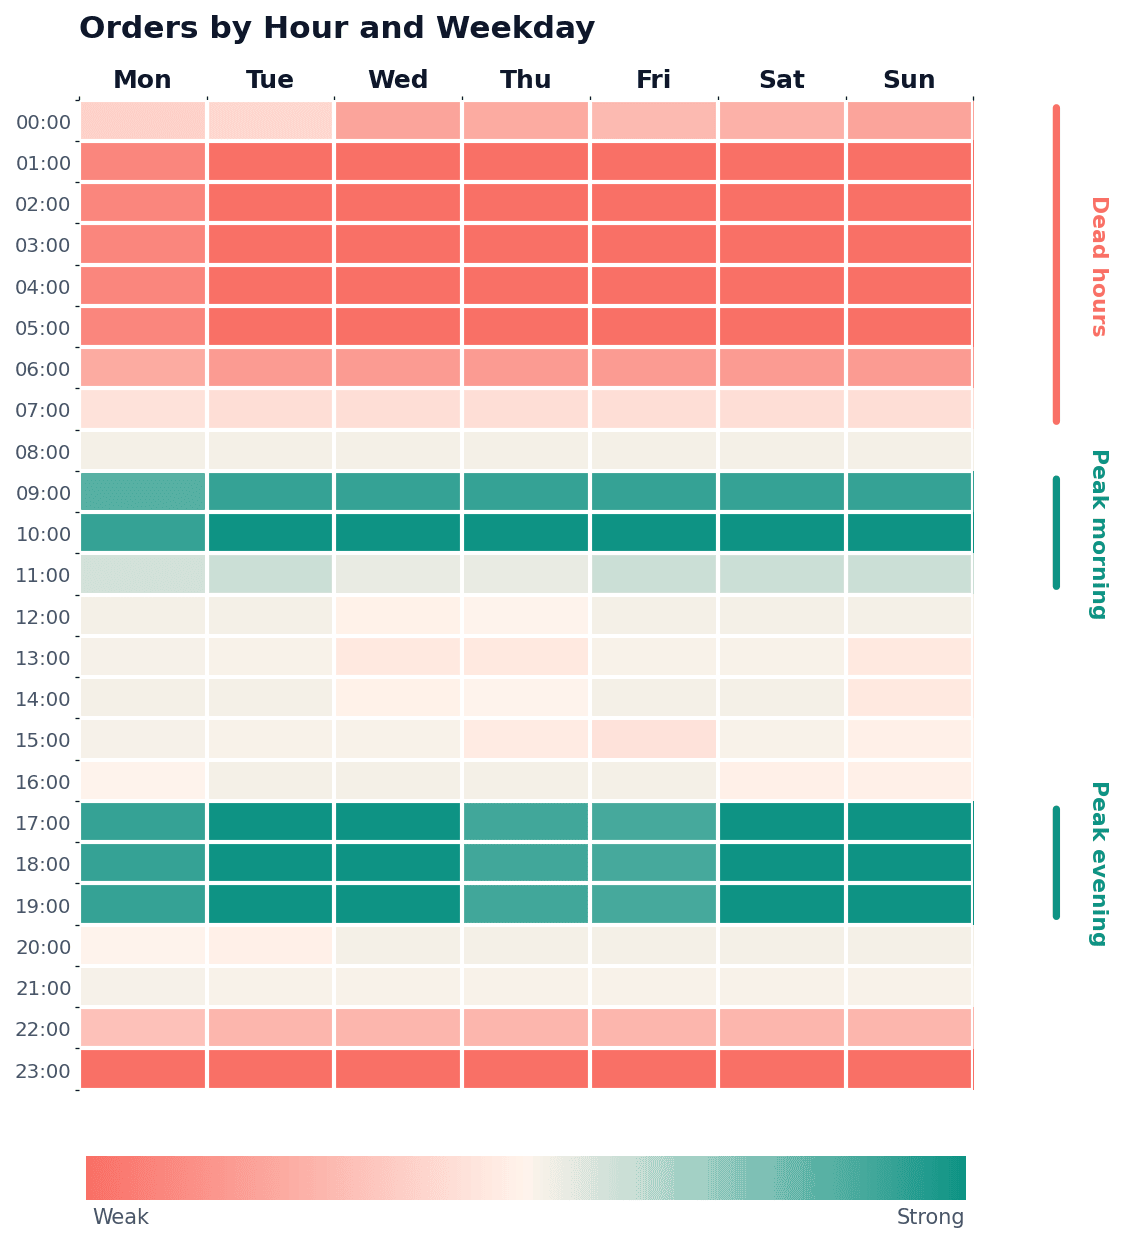
- Mapped the hours. Analyzed hourly and daily conversion patterns to find stronger weekday windows and weaker weekend performance.
- Concentrated spend. Reduced exposure during inefficient periods and focused budget on the best-converting hours.
- Ran focused flash windows. Used 12-hour flash-sale windows on selected top products, helping generate roughly 2X revenue during those periods.
Tool-led monitoring
- Watched 100+ ASINs continuously. Used tools and alerts to surface overspending, budget limits, declining conversion, and scaling opportunities.
- Kept a human in the loop. Combined automation with manual strategic review so the account moved quickly without losing control.
We Manage Amazon Complexity, So You Can Focus On Scaling
Built for brands that want predictable Amazon performance without micromanaging every detail.
Real growth. Backed by real numbers.