
A saturated niche, the highest price, and ROAS of 1: how Sellonics built a £100K skincare brand in a year.
One-year contract goal: grow the account past £100K per month. Achieved — June 2026 reached £99,062.
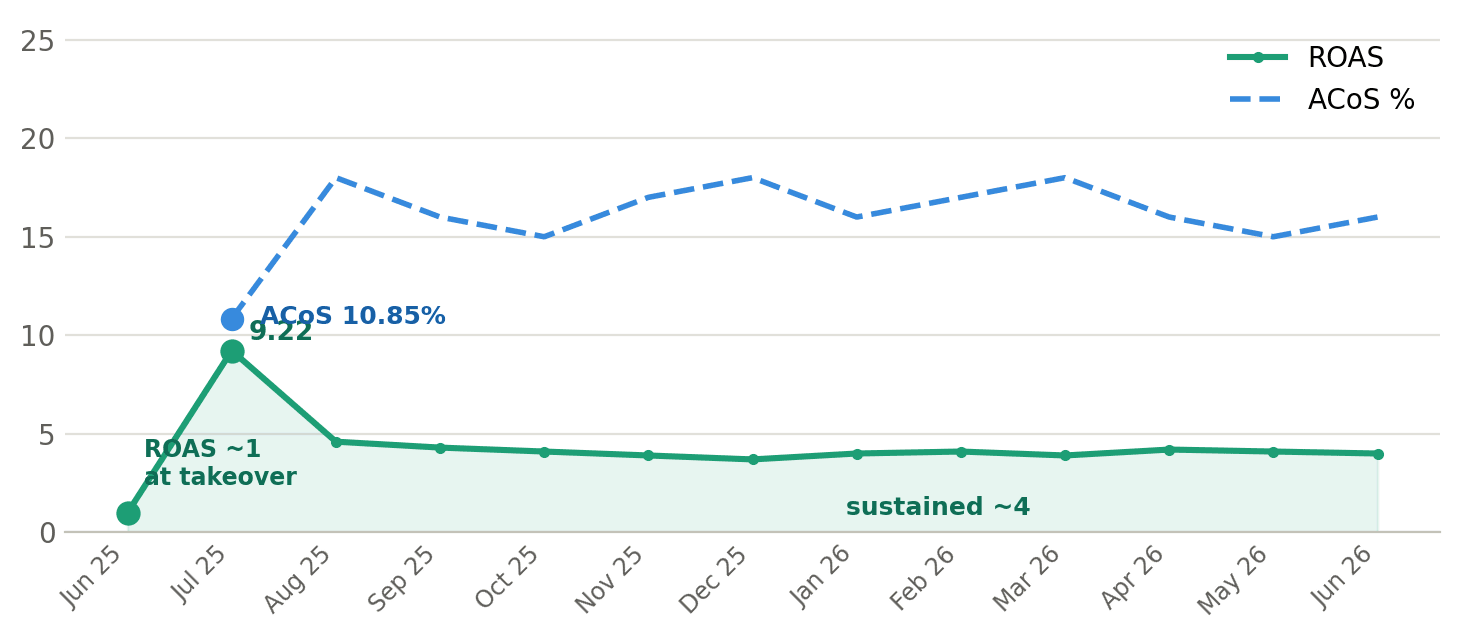
Baz & Co is a premium men skincare brand on Amazon UK, offering products at the highest price point in its category. When Sellonics took over in June 2025, the brand was stuck near £13,000 a month with ROAS as low as 1, almost entirely dependent on branded search and organic sales. The one-year goal was clear: grow the account past £100,000 a month. Sellonics rebuilt the paid-search engine, drove ROAS from 1 to 9.22 in a single month, sustained it near 4, and scaled revenue to £99,000 by June 2026, hitting the target.
At a glance:
Client: Baz & Co
Category: Premium skincare & grooming (face wash, scrubs, deodorant)
Marketplace: Amazon UK
Engagement: June 2025 to June 2026
Reported metrics: ROAS, ACoS, Total Revenue

What we achieved
Revenue was held near £13K through June and July while advertising efficiency was rebuilt, taking ROAS from 1 to 9.22. This efficiency-first sequence is why the subsequent scaling held: with ROAS sustained near 4 from August onward, monthly revenue rose to £99K by June 2026, meeting the £100K target. Like-for-like, the six months after January delivered 154% more revenue than the six months before.
Ad efficiency across the engagement
Detailed Results
Headline Metrics
- At Takeover
- Best / Sustained
Full figures
| Metric | At Takeover | Best / Sustained | Result |
|---|---|---|---|
| Monthly Revenue | £13,662 | £99,062 | £100K Goal Hit |
| Revenue (6-Month Blocks) | £157,257 | £400,147 | +154% |
| ROAS | ~1 | 9.22 peak / ~4 sustained | 9x in Month One |
| ACoS | 10.85% | 14% | — |
Six months before vs after January — Jul to Dec 2025 (£157,257) vs Jan to Jun 2026 (£400,147): a 154% increase in total revenue.
Month-over-month revenue (full series)
Full figures
| Month | Total Revenue |
|---|---|
| Jun 2025 | £13,662 |
| Jul 2025 | £13,545 |
| Aug 2025 | £12,525 |
| Sep 2025 | £18,171 |
| Oct 2025 | £22,679 |
| Nov 2025 | £27,932 |
| Dec 2025 | £62,406 |
| Jan 2026 | £37,328 |
| Feb 2026 | £47,558 |
| Mar 2026 | £57,750 |
| Apr 2026 | £77,593 |
| May 2026 | £80,857 |
| Jun 2026 | £99,062 |
Monthly revenue across the engagement. Flat at the start during the efficiency reset, then climbing steadily to £99K. The January dip reflects normal post-holiday seasonality.
The Challenges
Highest price in the category
Priced above the market best sellers, raising the conversion bar against cheaper rivals.
Growth capped by branded search
The majority of revenue came from branded search, leaving little room to acquire new customers.
Non-branded ads inefficient
Paid search on non-branded and category terms was converting poorly and wasting spend.
Weak creative, low ad engagement
The existing ad creative was underperforming on click-through in a category of near-identical listings.
ROAS at 1 on takeover
At handover, advertising returned roughly £1 for every £1 spent.
Revenue flat at £13K/month
An organic-dominated sales mix left monthly revenue static with no paid growth lever.
Our Approach
Efficiency before scale
Spend was tightened and wasteful targeting cut, rebuilding ROAS from 1 to 9.22 in month one before scaling revenue.
Expand non-branded search
Non-branded targeting was scaled gradually, retaining converting keywords and filtering out those that wasted spend.
Test category targeting
Category-level targeting was used to reach in-market shoppers beyond keyword search.
Build virtual bundles
Virtual bundles were created to drive bulk purchase and lift average order value.
Run brand-awareness ads
Sponsored Brands product collection ads were used to build top-of-funnel awareness for a premium product.
Mine auto campaigns
Auto campaigns surfaced new converting search terms, which were promoted into structured campaigns.
Shift to phrase match
Match-type analysis showed phrase match converting best, so the strategy shifted decisively toward it.
Manage spend daily
The account was reviewed daily to cut wasted spend and hold efficiency as volume scaled.
We Manage Amazon Complexity, So You Can Focus On Scaling
Built for brands that want predictable Amazon performance without micromanaging every detail.
Real growth. Backed by real numbers.